The Okanagan's Water Story
With less water available in the Okanagan than anywhere else in Canada, we use more water than most.
The Okanagan is on the front lines of climate change. Shifting between flooding, drought, and extreme fire seasons, we are seeing more and more extreme weather events.
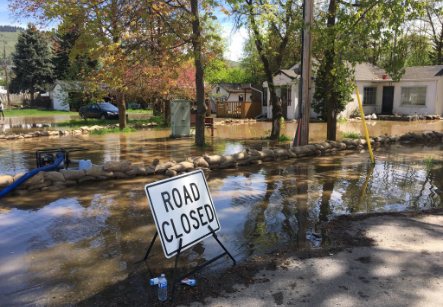
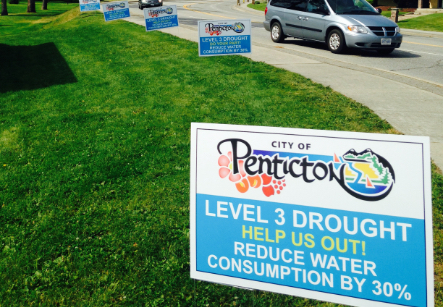
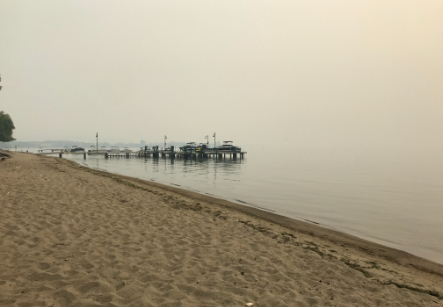
Research shows that this will become more common in our valley—and beyond. But there are things we can do today to reduce impacts, prepare and even improve our situation.
As we face our climate challenges, Make Water Work shows that small changes can yield big results. We’re helping residents improve irrigation, create resilient landscapes, and ensure a healthy, sustainable water supply for our valley.
What can you do?
If you water (not everyone does)… make sure to follow the tips here to get the most from your water.
Find water restrictions for your neighbourhood using the drop down menu below.
Great reasons to reduce your water use
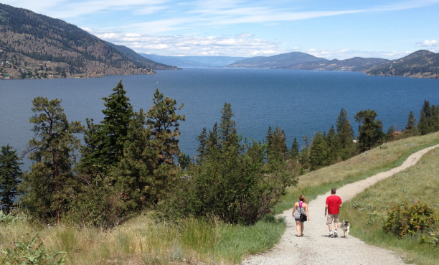
- There is LESS water available per person in the Okanagan than anywhere else in Canada. (Source: Statistics Canada, Human Activity and the Environment: Annual Statistics 2003. Catalogue no. 16-201-XIE, p. 8.)
- The Okanagan has one of the highest rates of water use per person in Canada.
- The 2nd largest use of water in the Okanagan is used on our household lawns & gardens.
Our lakes don’t equal an endless supply of water…
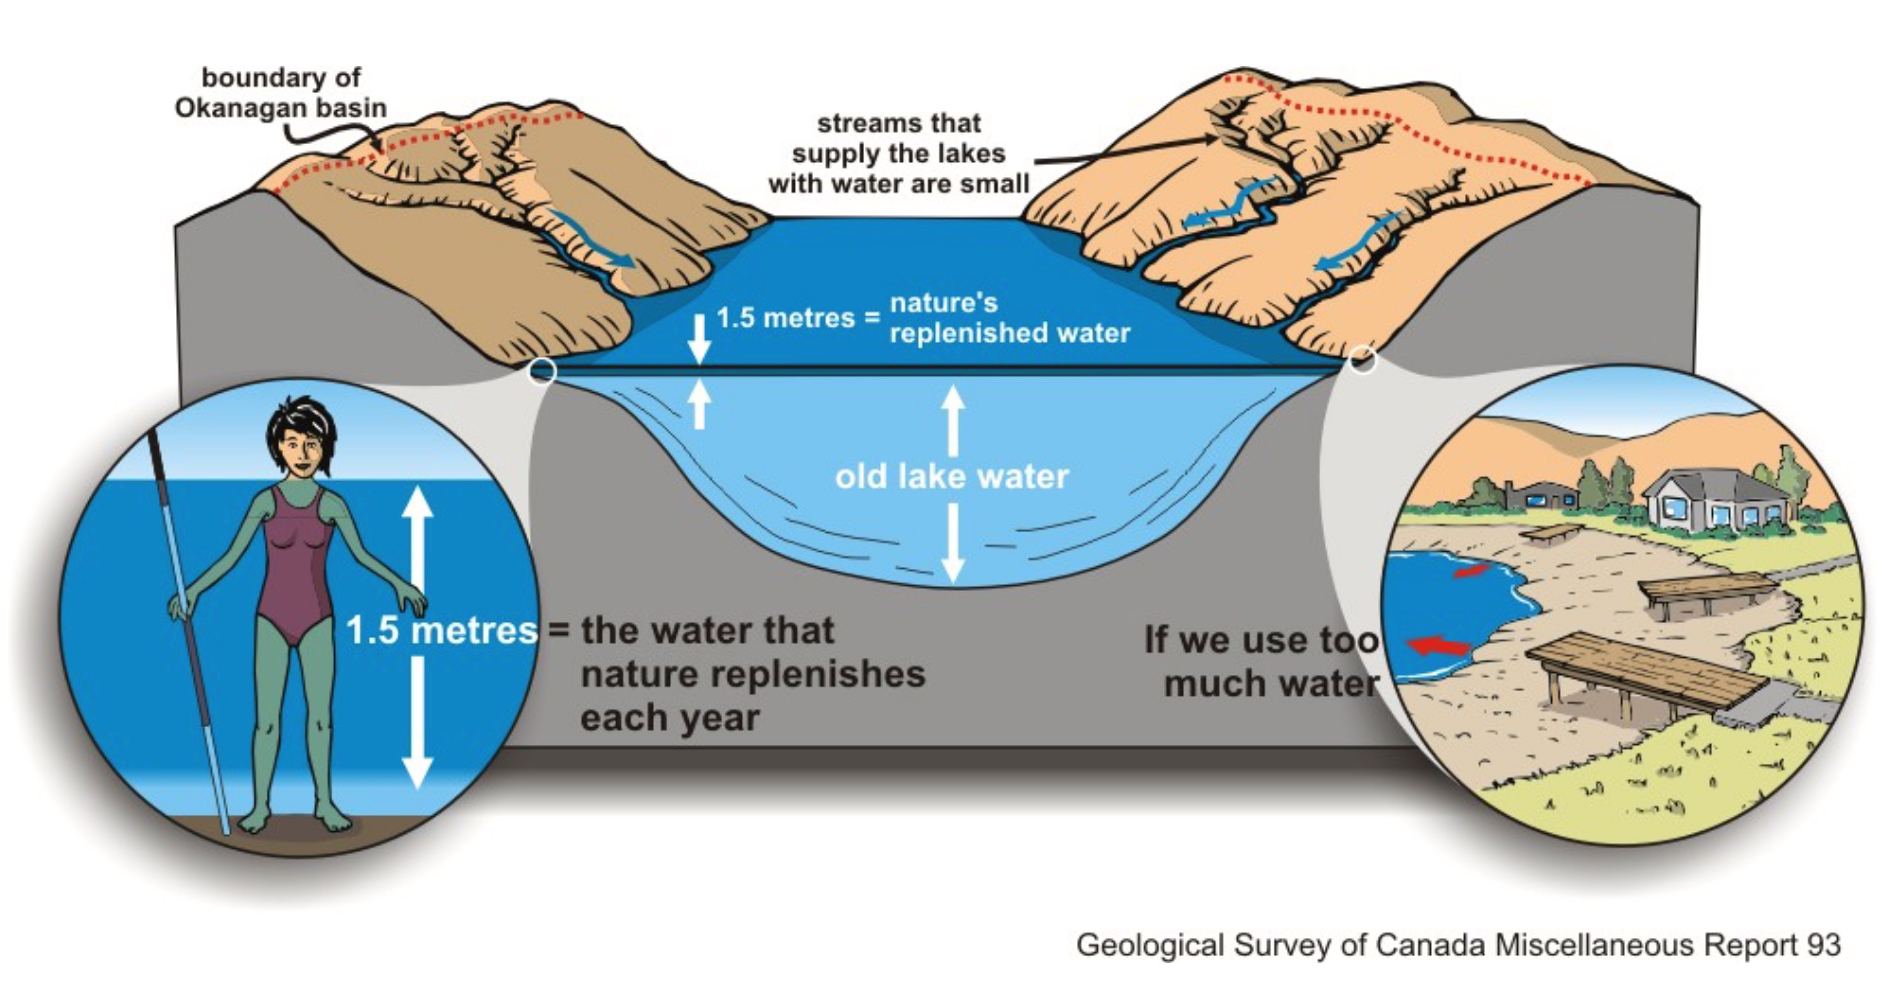
Our valley lakes can be as beautiful as they are deceiving. This has become known as “They Myth of Abundance.” Although it may seem like our water supply is vast, Okanagan Lake—the primary source of our water—only fills 1.5 metres in an average year. This happens thanks to melting snow and precipitation, mostly in the spring.
To protect the valley from disastrous flooding, Okanagan Lake is managed to not hold over that 1.5 metres of spring inflow. In a dry year, the lake may not even refill that full 1.5 metres.
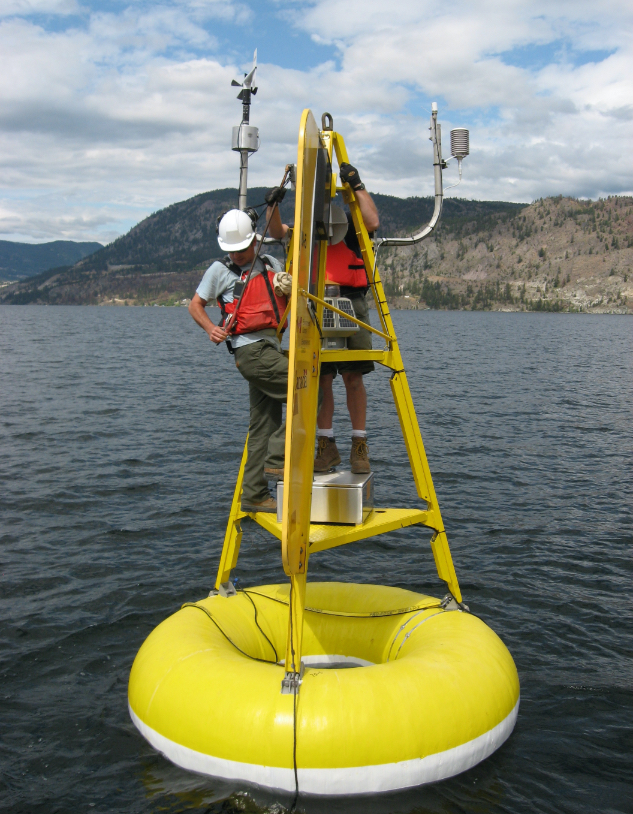
Photo: Evaporation research bouy on Okanagan Lake, July 2011. Photo courtesy of Environment Canada.
Water “loss” in an already water-stressed region
Water managers also consider evaporation when maintaining lake levels. Between 725 and 835 mm of water evaporates from Okanagan Lake each year.
Unfortunately, when we experience dry years, evaporation and our demand for water still exist.
During 2015, wildfires broke out around our parched valley. Water restrictions tightened. There was legitimate concern that low water supplies would hurt farmers and their output. Fish returning to spawn also faced lower water levels. The drought stressed our environment and economy. And, this has been repeated in subsequent years.
Today, we have the chance to make things better now and into the future.
How we spend our water budget
We share Okanagan Lake between fish, wildlife, and many human users including residential, agricultural, commercial and industrial businesses. Demands on our water are growing. Our population is increasing. And so are our agricultural needs because of climate change and the impact this is having on growing conditions.
Each year, provincial water managers draw down Okanagan Lake in the winter to make room for spring freshet (thaw). They work to reduce flood risk and ensure enough room for the expected 1.5 metres that will carry us through until the fall when people turn off the irrigation and the fish have returned to spawn. This draw down considers how much water is in our snowpack and how much spring rain will fill the lake.
As people in the Okanagan irrigate in the spring, we withdraw from the water stored in the lake. As the summer gets hotter, irrigation increases, and so does stress on our water supply. This continues into fall.
Residential Use
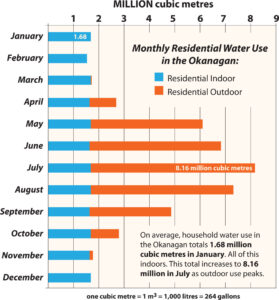
Recent research by the Okanagan Basin Water Board provides an account of how much water we use in the valley, and when. As the chart below shows, residential outdoor water use spikes in April when we turn on the taps for our lawns and gardens. That continues all the way into October, with a few still running the tap into November.
Agriculture & Other Use
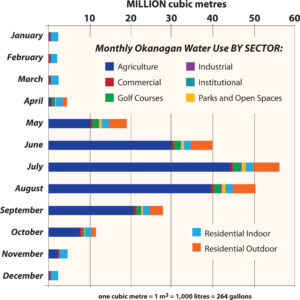
Interestingly, research also shows which sectors use what amount of water, and when.
As you might expect, agriculture uses the greatest amount of water between April to October for crop irrigation. While water use by some sectors remains stable throughout the year, golf courses, parks and agriculture use more mid-spring to mid-fall.
Agriculture accounts for the largest use of water, but we refer to this as “working water” since it feeds our communities and economy. There is no room for waste. Especially not in an area known as Canada’s most water-stressed region
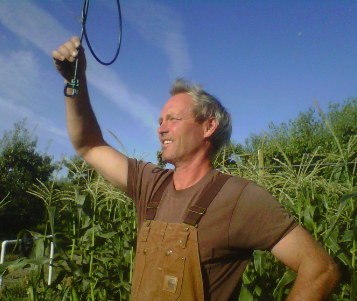
Photo: Okanagan farmer inspects his irrigation system.
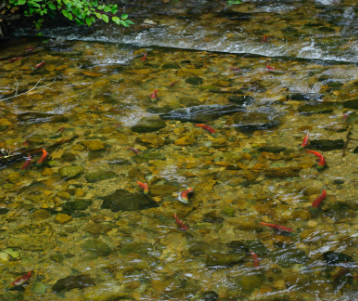
Photo: Kokanee spawning at Hardy Falls, Peachland. Photo courtesy Regional District of Central Okanagan
The Okanagan Basin Water Board works closely with water utilities in the valley and farmers to be WaterWise. Learn more about one such initiative here.
We can all take small steps to reduce our use during these peak times.
As the valley grows and costs of treating water rises, we need to ensure that we all make water work smarter.
What can you do?
If you water (not everyone does)… make sure to follow the tips here to get the most from your water.
Find water restrictions for your neighbourhood using the drop down menu below.
For more information on what you can do in and around your home, and in our community, to be WaterWise year round, visit www.OkWaterWise.ca.
More links
-
Okanagan Basin Water Board
– Okanagan Agricultural Water Users Resource Page.
Help for farmers to use water effectively and be ready to respond if drought conditions worsen during a growing season. -
OBWB – OkWaterWise
– OkanaganFloodStory.ca.
This website includes flood maps for the Okanagan, helping residents and local governments understand flood concerns and prepare. Visitors to the site will also find historical flood information, how climate change is affecting flooding, and how residents and local government can reduce risk, prepare, respond, recover, and more. -
Regional Districts of the Okanagan
– Climate Projections for the Okanagan
This report, prepared in partnership with the OBWB–OkWaterWise, looks at projected changes for the 2050s and 2080s. The report lays the groundwork for everyone to respond and act in a meaningful way to help mitigate the potential challenges we face in the years ahead. -
B.C. Government
– Drought Information Portal.
A geographic drought level information system for B.C. Drought levels and other data are updated regularly as it becomes available.
